← Catalog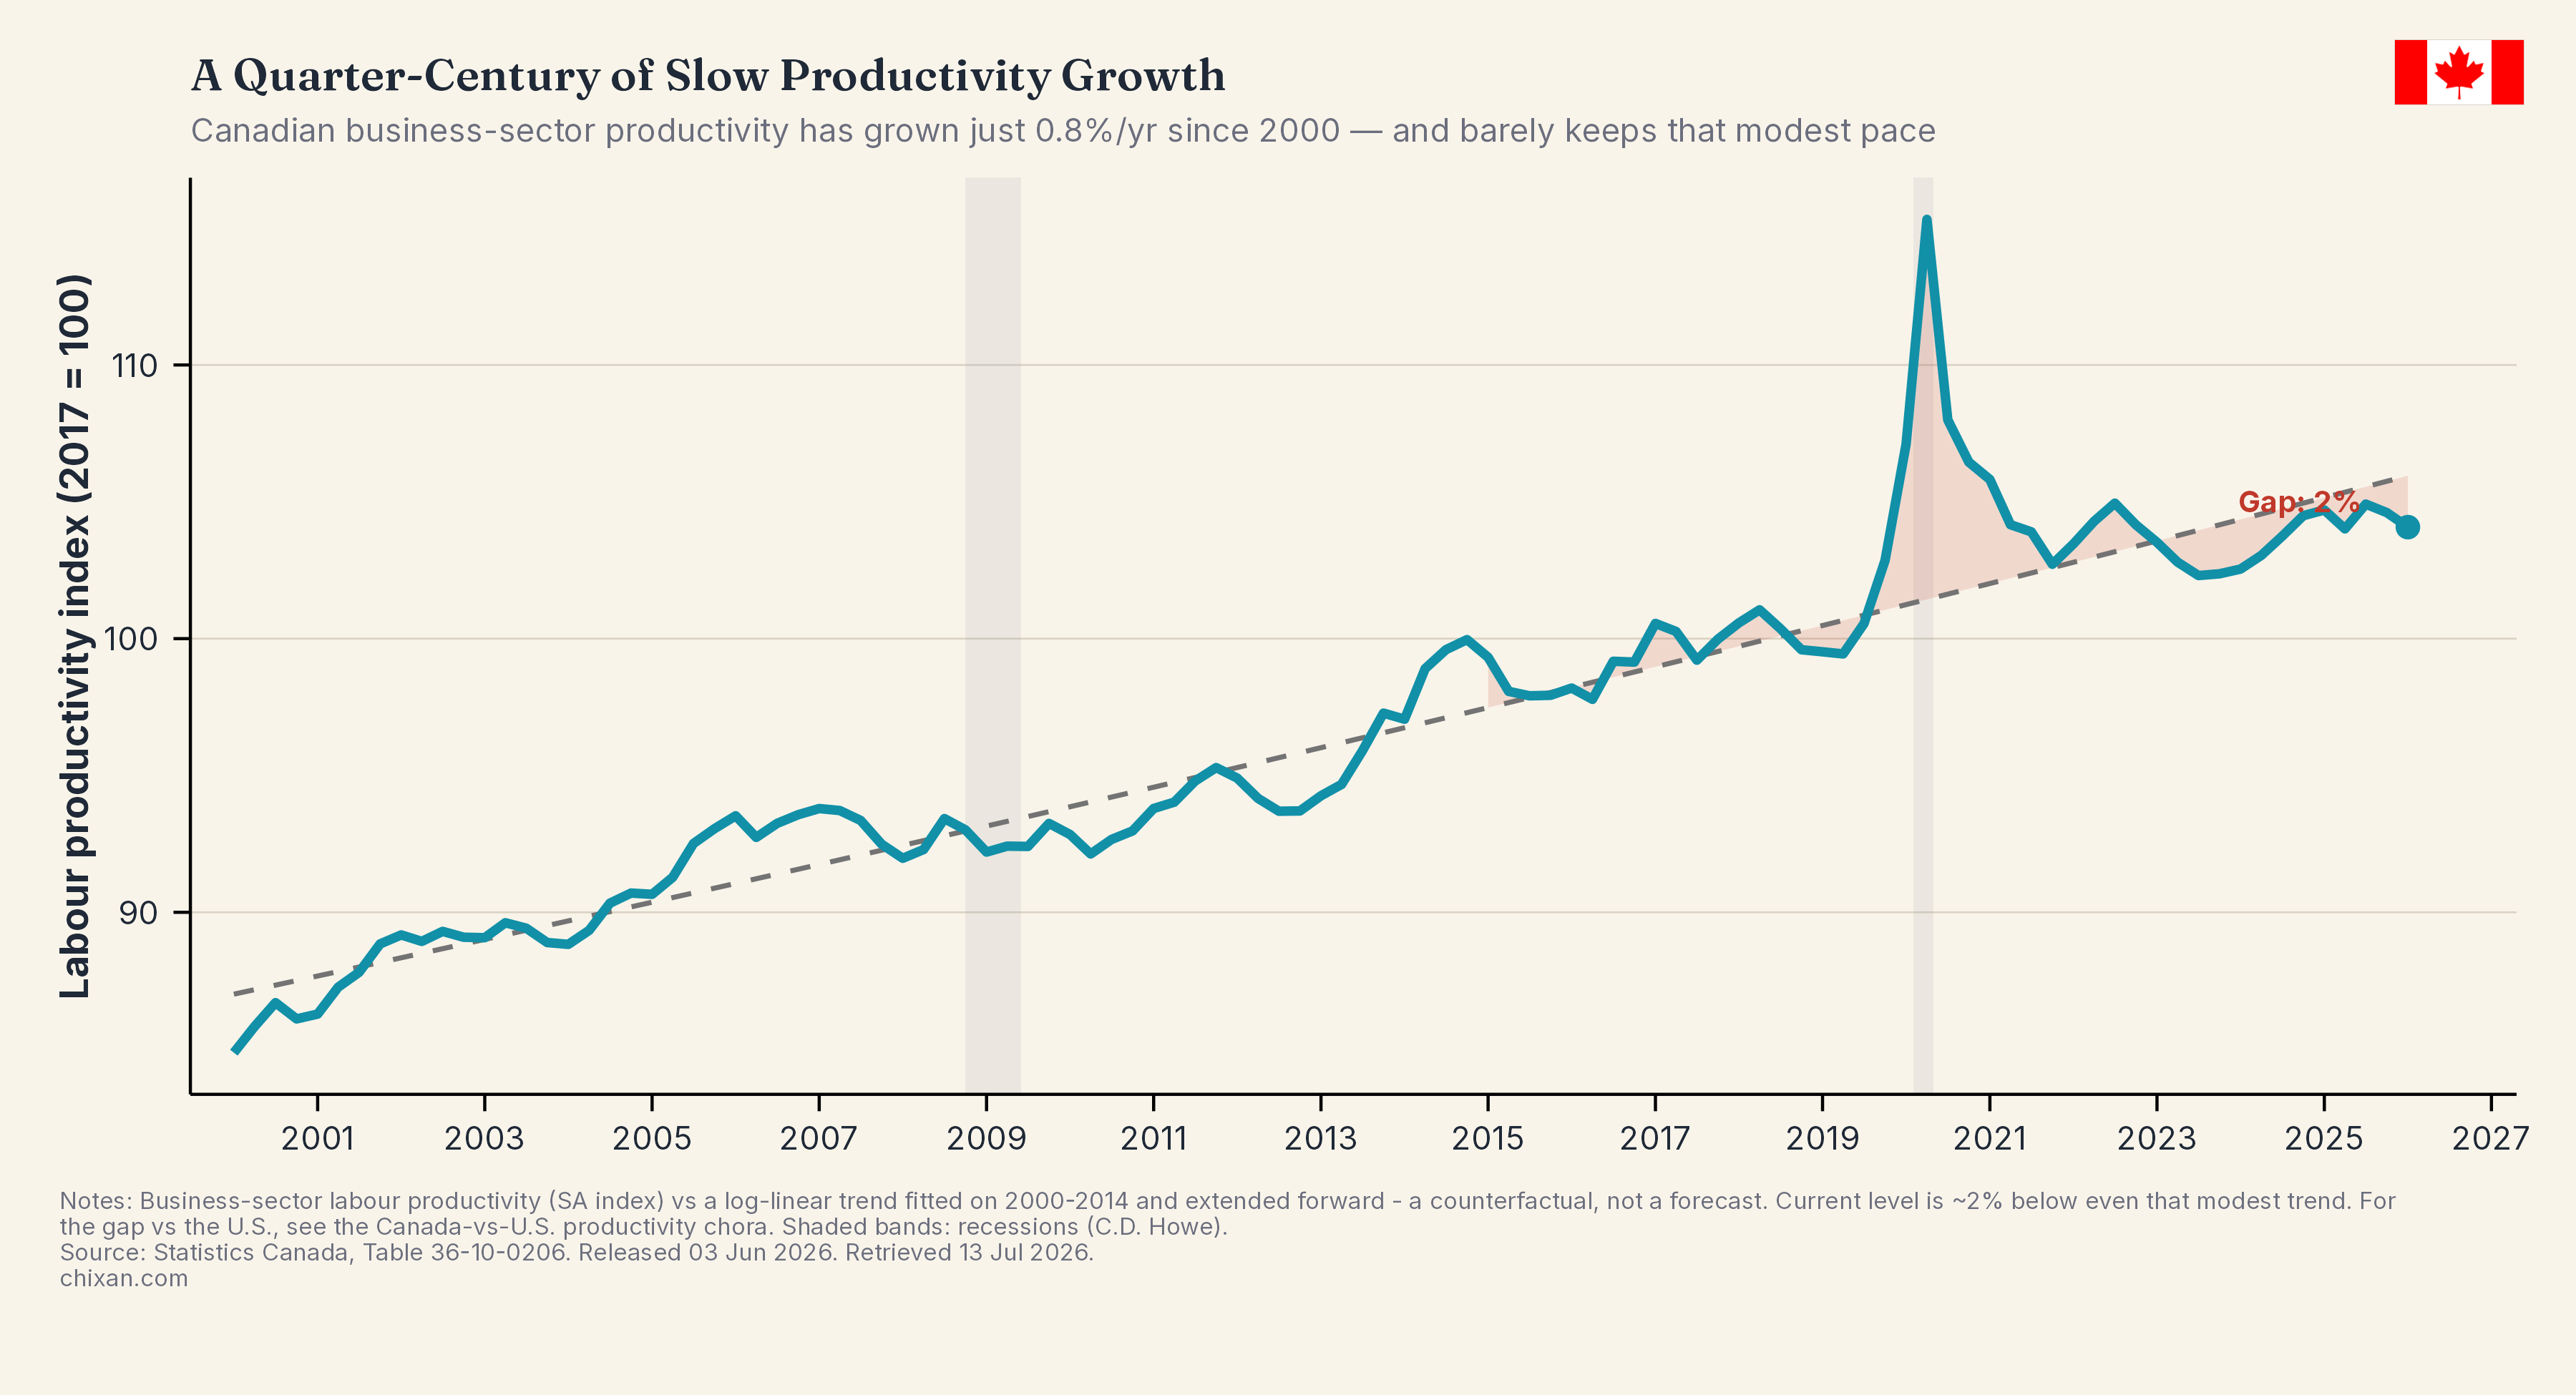
Source: Statistics CanadaData through Q1 2026 · Updated Jul 4, 2026 All productivity →
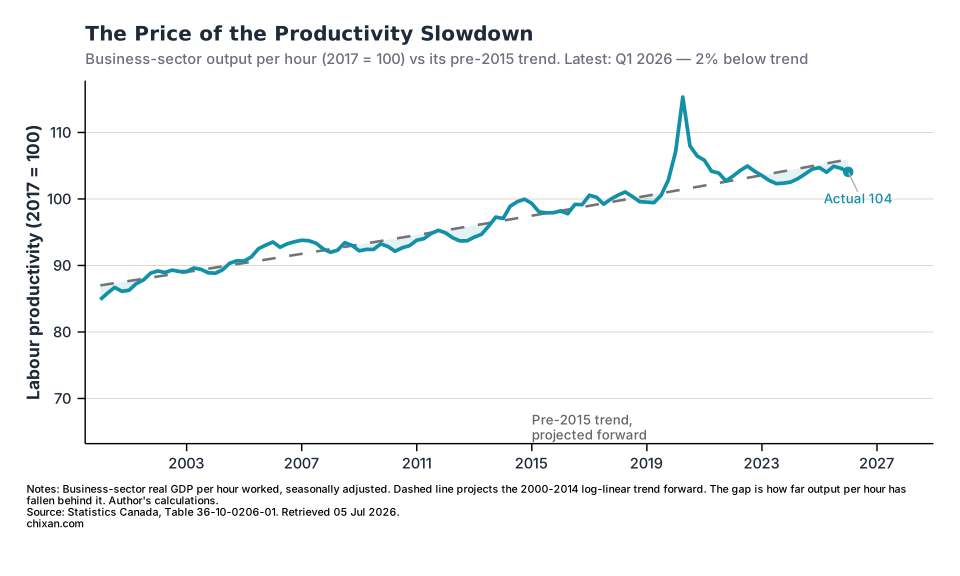
The Price of the Productivity Slowdown
Business-sector output per hour vs its pre-2015 trend — the gap is how far productivity has fallen behind
Download
Free to use with attribution — CC BY 4.0.
Embed — stays live
Paste this where you want the chart. It updates itself whenever the data does.
<iframe src="https://chixan.com/embed/productivity/productivity_slowdown_cost/" width="640" height="440" style="border:0" loading="lazy" title="The Price of the Productivity Slowdown — Chixan"></iframe>Cite this chart
Chixan (2026). The Price of the Productivity Slowdown. Statistics Canada. https://chixan.com/charts/productivity/productivity_slowdown_cost/