Paste this where you want the chart. It updates itself whenever the data does.
<iframe src="https://chixan.com/embed/trade/export_exposure_gdp/" width="640" height="440" style="border:0" loading="lazy" title="How Much of Each Province Rides on U.S. Demand — Chixan"></iframe>
Cite this chart
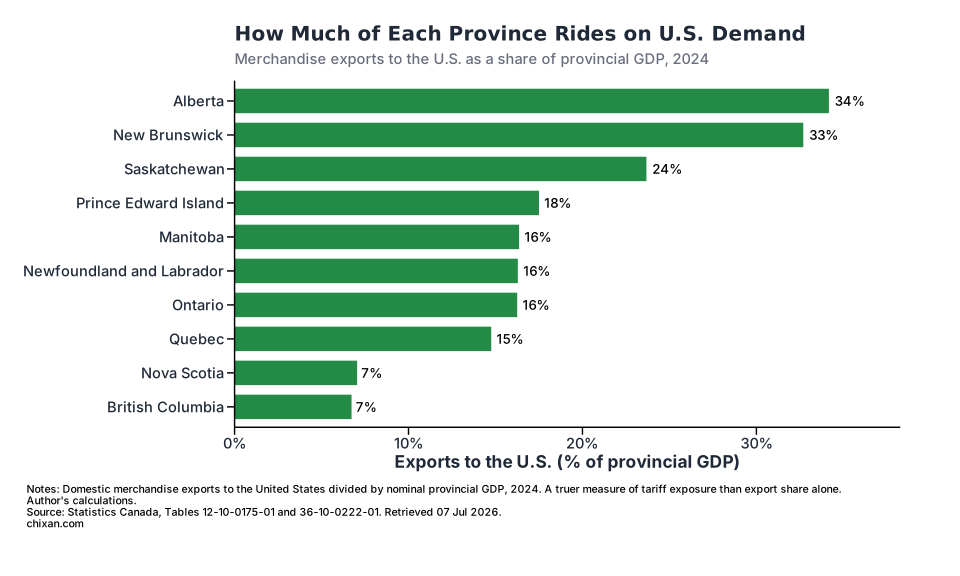
Chixan (2026). How Much of Each Province Rides on U.S. Demand. Statistics Canada. https://chixan.com/charts/trade/export_exposure_gdp/