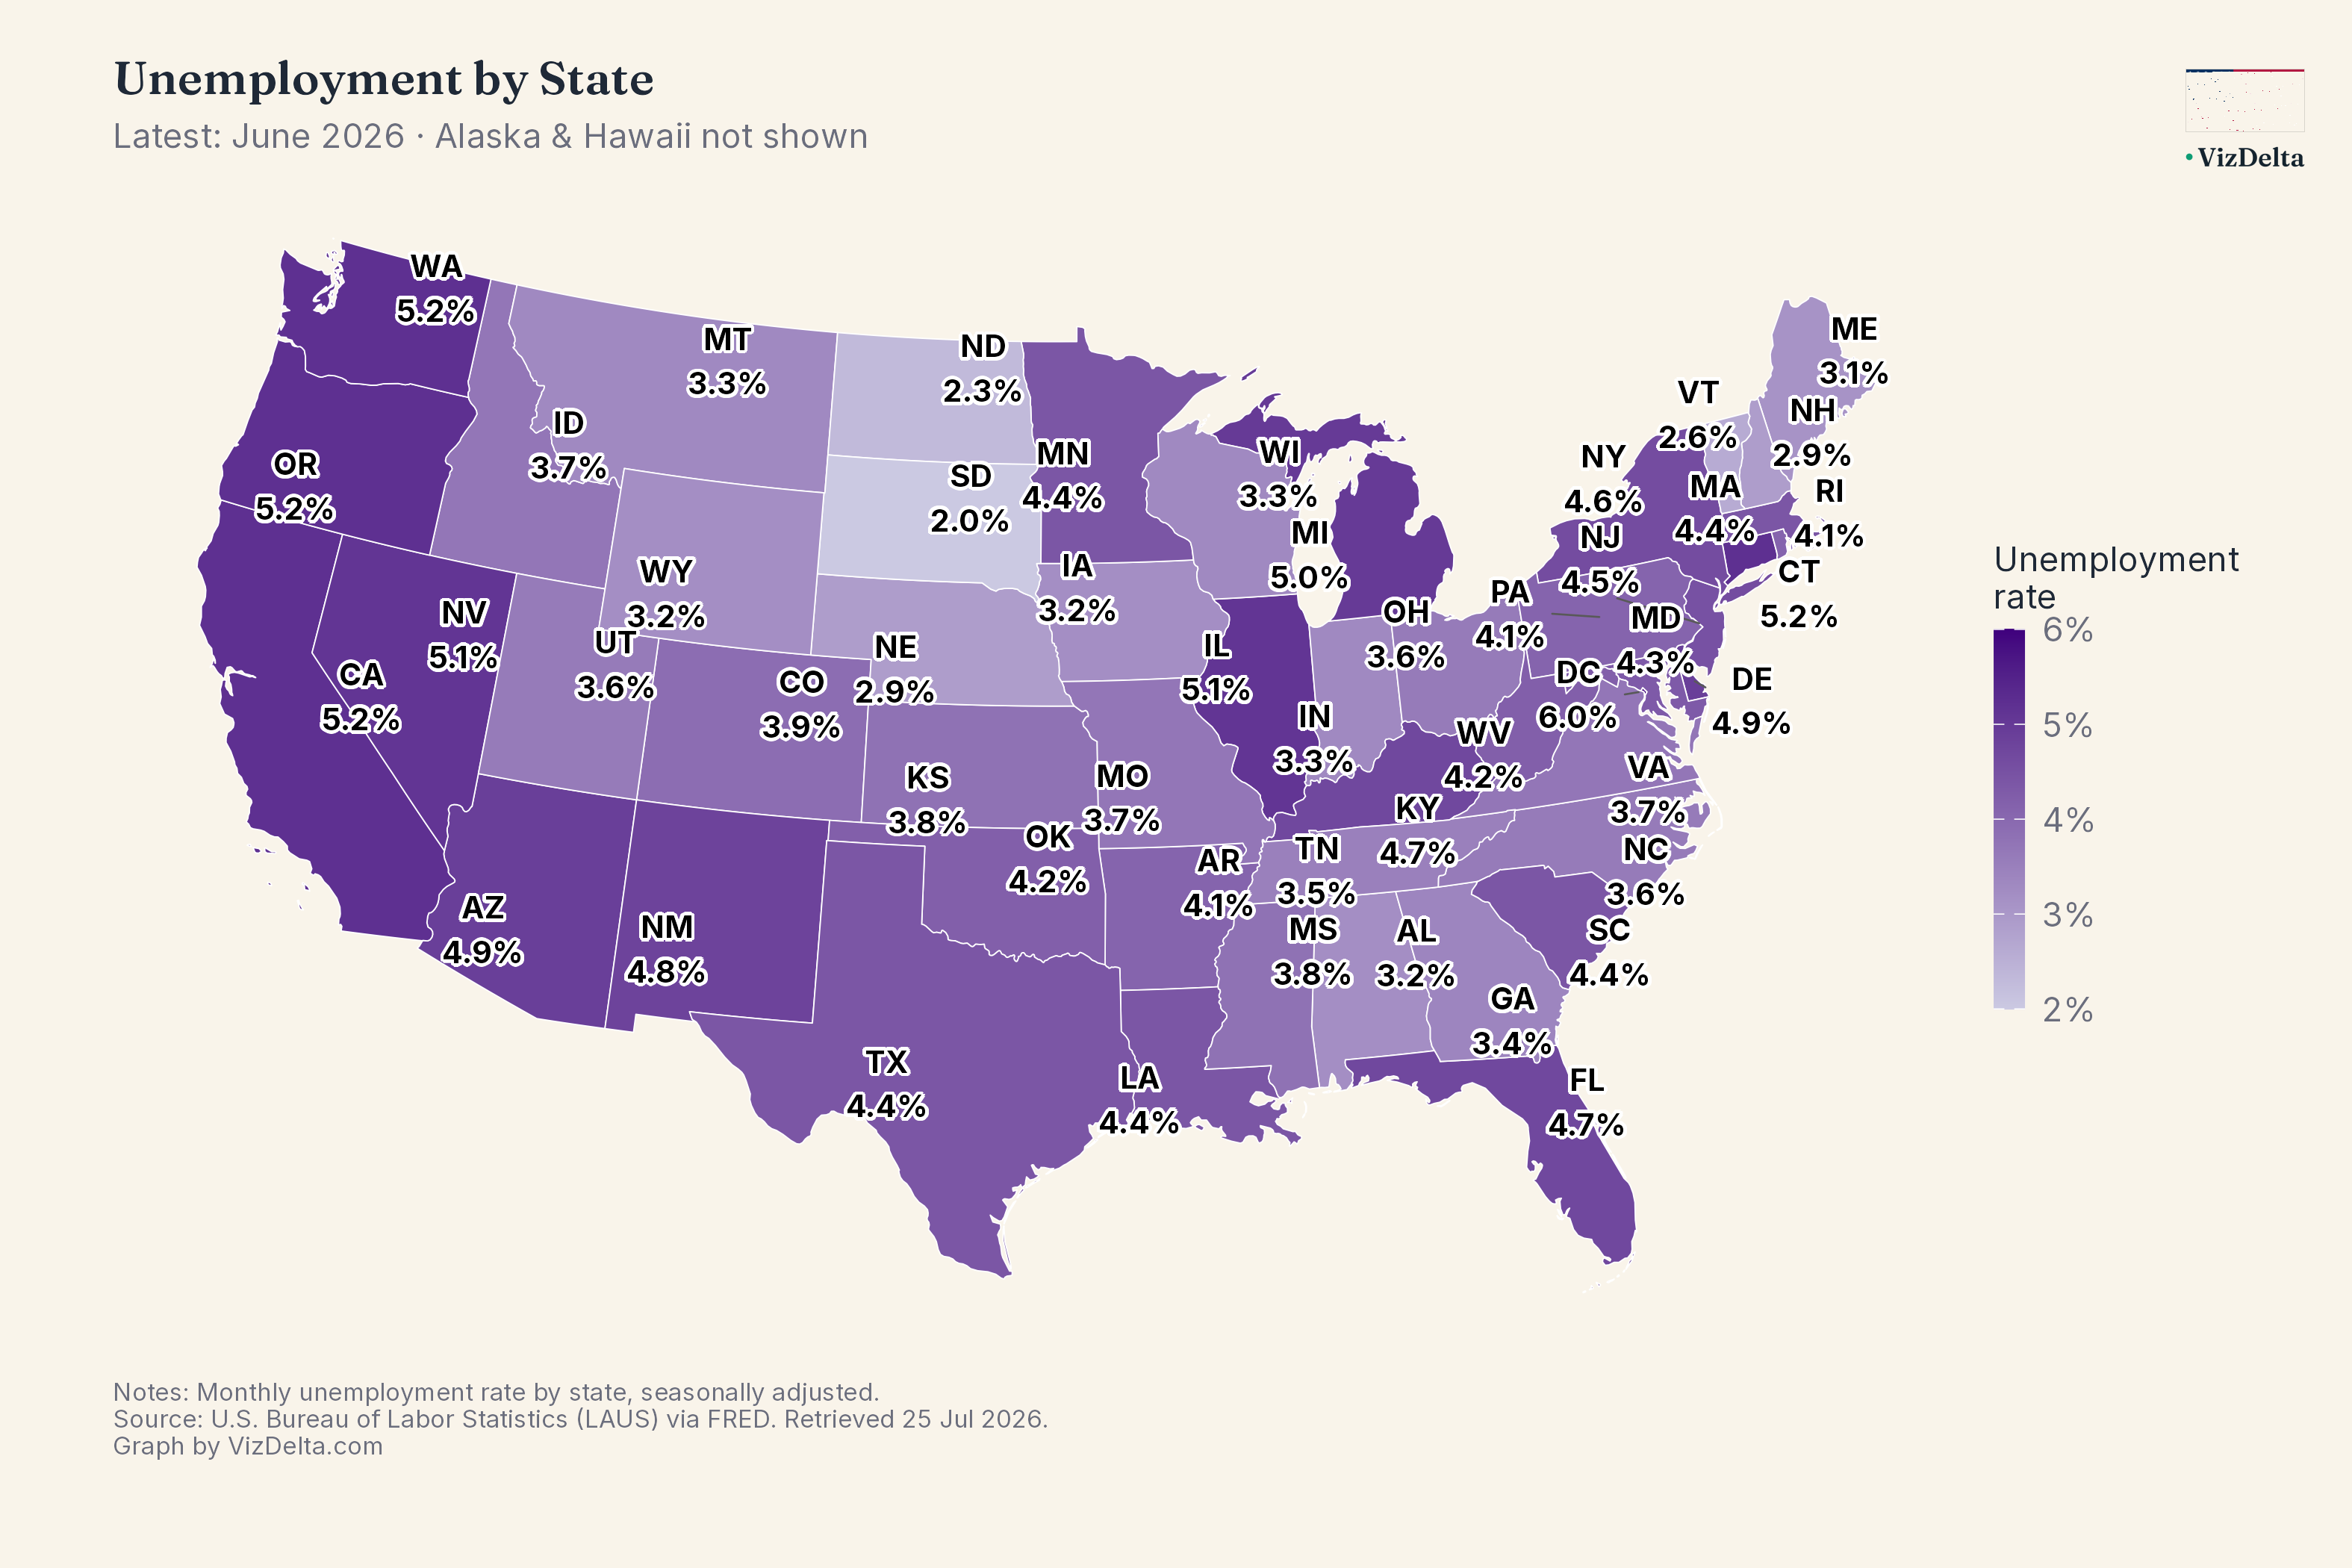
Monthly unemployment rate by every U.S. state, seasonally adjusted — the clearest single picture of where labor markets are tight versus slack.
Source: U.S. Bureau of Labor Statistics (FRED) · LAUS (state unemployment rate, [state]UR)Data through May 2026
Was this useful?
One tap — that's it, unless you want to say more.
✓Thanks — noted.
Tell us more
✓Sent — really appreciate it.
▸ How to read this map
Each region is shaded by its own value for the latest period — darker or more saturated usually means higher. There's no time axis here, just a single snapshot; open it fullscreen to compare regions side by side.